Recently I’ve stumbled upon a nasty error thrown by karma, that was raising in the middle of bundle compilation of our package. To make things worse, code compilation worked fine when launching the project in a browser. It was crashed only while preparing a bundle in order to perform unit tests.
The error said that there was an Invalid Left-Hand Side in arrow function parameters somewhere in our code. It provided a stack trace and a position in form of FileName.ts:123 which it fine, right?
Unfortunately, the line indicated by the error was something like this:
await this.doSomeUpdates();
which doesn’t really look like an arrow function ;).
The problem
Our codebase is written almost exclusively in TypeScript, so in order to launch unit tests in Chrome, we need to transpile it into JavaScript. The code is compiled and bundled using Webpack, stored in memory and launched by karma in a headless browser instance.
It was clear, that the line indicated by the error, was pointing to a compiled file stored in memory, rather than to a TypeScript source file. I saw two possibilies to cope with this problem:
- Review the Webpack and/or karma configuration files, spend infinite amount of hours googling and troubleshooting, hoping that some fix will magically make the error point to a correct line, or…
- Debug karma launching our tests, chase down the error and find the source file in memory that causes problems.
The solution
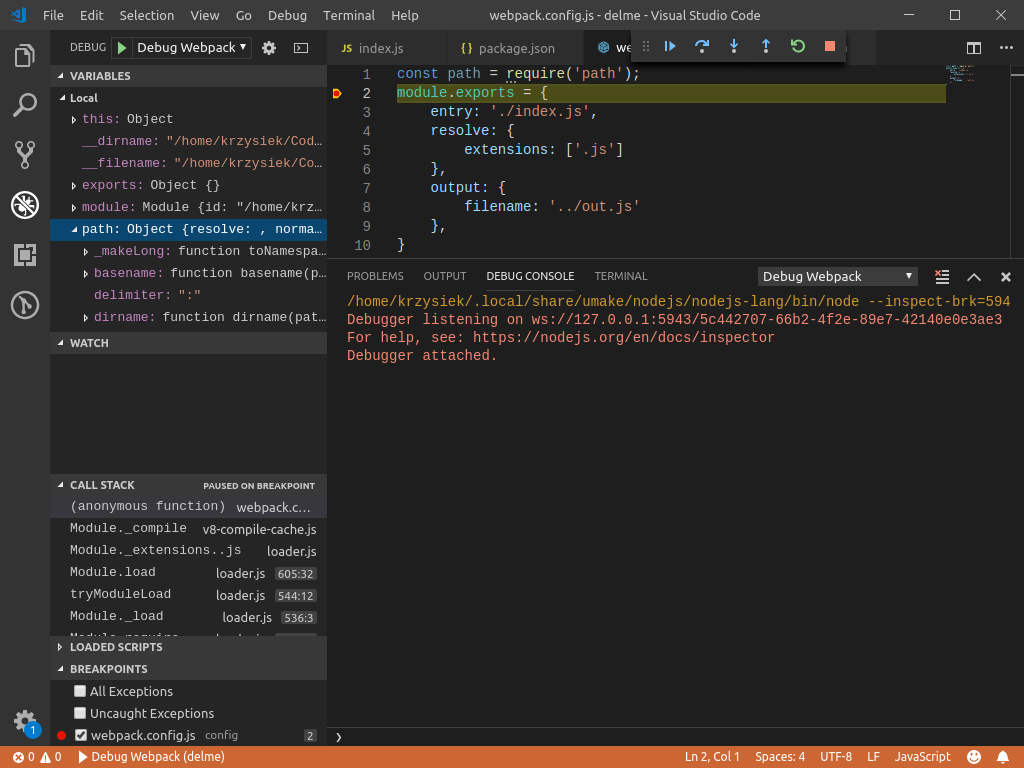
Since NPM tasks are simply JavaScript files, it is possible to run them within the Visual Studio Code debugger. This way we can debug the internals of libraries and track any ambiguous errors, uncaught exceptions and other surprises.
All of your locally installed packages are located in thenode_modules directory. It has a special folder named .bin which typically contains scripts that act as “executables” of the downloaded modules. So nothing stops us from pointing to them within the VSCode‘s launch.json file.
Let’s say that we’d like to debug a Webpack config file. Considering a following task being defined in a package.json:
1 | { |
its equivalent in .vscode/launch.json would be:
1 | { |
After saving the launch.json file, we can select Debug Webpack from Configuration selector, run the script with F5 and… that’s it!

Happy debugging! 🐞
Photo by Helloquence on Unsplash.