Apache Cordova gives us a great opportunity to build mobile applications using the web development stack. It does so by embedding an HTML document into a special instance of a web browser and exhibiting several additional APIs in JavaScript.

It all sounds great until the first obstacles appear in our sight. Sooner or later sooner we need to test the application and debug all of the unexpected behaviours. There are several ways of doing so, depending on the version of the device we want to test.
From Chrome Dev Tools to raw ADB logcat output. This article covers debugging in desktop web browsers as well as in Android devices.
Serving application as a webpage using cordova serve
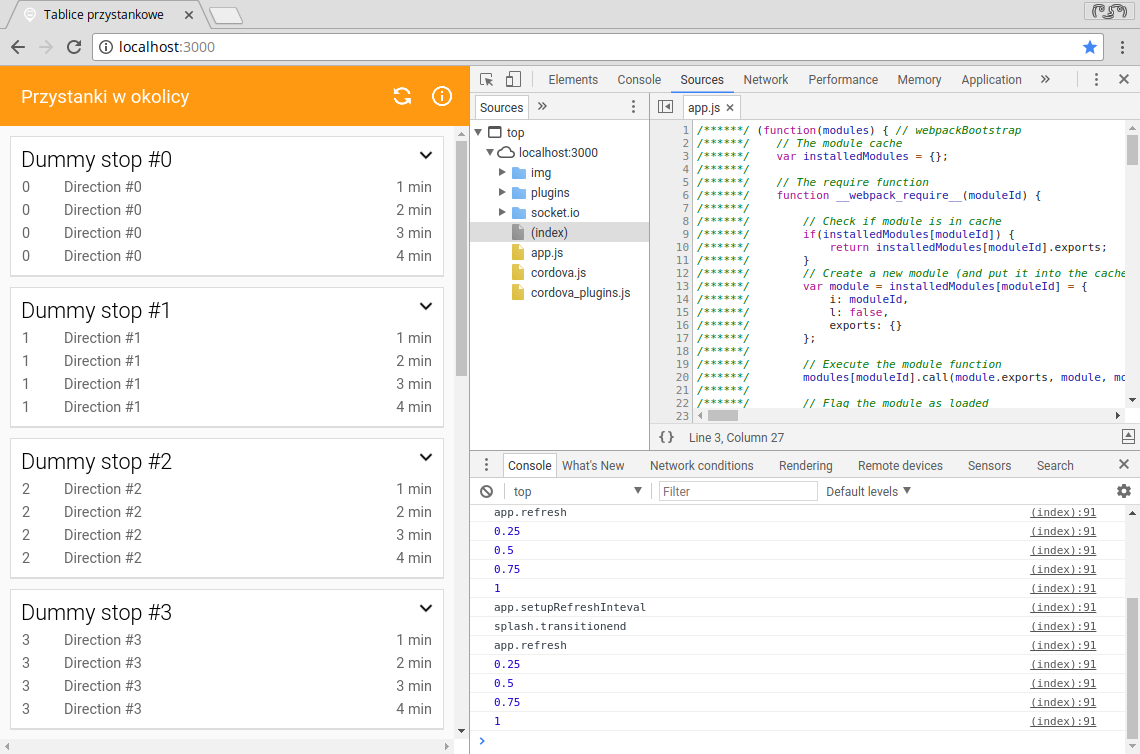
That’s the easy one. You can simply type cordova serve in your terminal and it will launch a web server which makes your application accessible via a regular web browser either on your PC or on your mobile device. In the first case you can simply use Chrome/Firefox Dev Tools in order to debug.
1 | $ cordova serve |

However, there are two catches in that approach.
First of all, some of the additional JavaScript interfaces provided by Cordova or its plugins will not be available. For instance, when using the served webpage I was not able to get the version using the cordova-plugin-app-version.
In addition to that, if your application makes HTTP requests to another service, you will have to deal with cross origin requests. It is not the problem when launching the actual application on a device, because there is no origin in such case. A solution to this is using mock data or (even better) setting up a proxy. I plan on writing a separate blog post on that topic.
Remote debugging on a target device
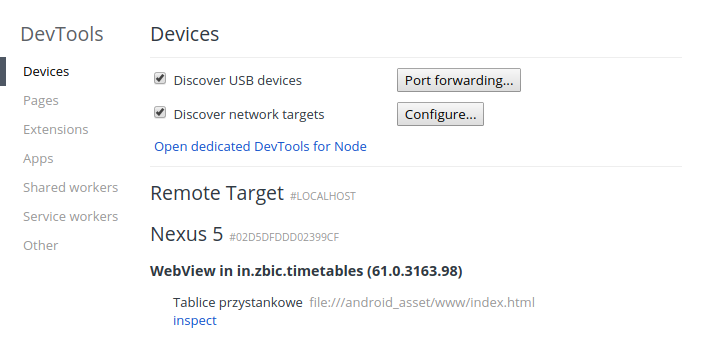
Some time ago, Google introduced the Remote Debugging functionality in Chrome and it is just awesome. It allows you to comfortably use regular, desktop Chrome Dev Tools to remotely debug the application running on your mobile device. In order to use it you have to:
- Install Android SDK on your desktop.
- Enable Developer Mode and allow USB debugging in your mobile device.
- Plug-in your mobile device to the PC using a USB cable.
- Launch the app in your mobile device.
- Go to
chrome://inspectin your desktop Chrome and enable discovering USB devices. - Open remote dev tools by clicking inspect right next to your device listed under ‘Remote Target’ section.

Unfortunately, it doesn’t work with Cordova applications running under Android 4. The reason behind that is that Chrome was not a default Android browser back then. Therefore, Cordova applications are hosted by a WebView which bases on the so-called Android Browser, not Chrome.
Weinre
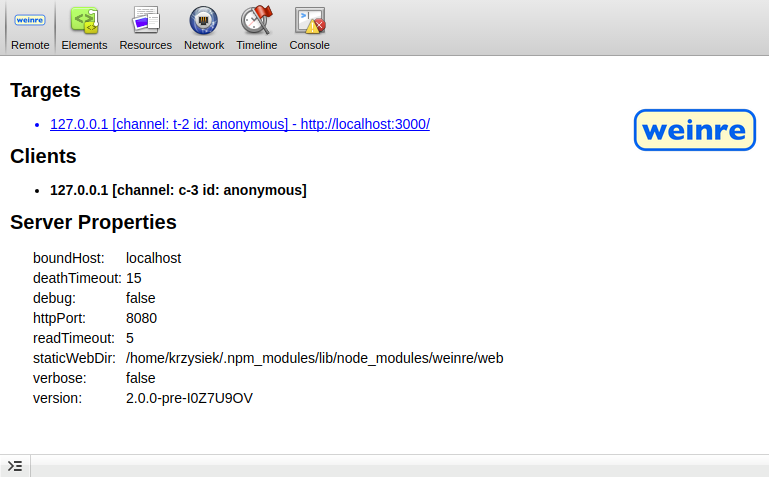
Weinre is very similar to Chrome Dev Tools, since they both share large parts of code. Nevertheless, they work a little bit different.

While Chrome Remote Debugging establishes connection with the target device via USB, weinre sets up a regular HTTP connection via the network. It makes the configuration a little bit more complicated, however we are not restricted to Chrome browser anymore which might be useful when debugging older devices.
ADB logcat
It may happen that the application crashes right after it starts e.g. because of some little syntax error that is unsupported by the target browser. Therefore neither Chrome Remote Debugging or Weinre may be able to attach themselves to the app soon enough to catch and display the error.
In such a case we can still grab some error output by attaching our device via a USB cable and using the adb logcat command from Android SDK. It dumps logs produced by the device, including ones coming from the embeded WebView and/or the native Android Browser.
- Plug-in your mobile device to the PC using a USB cable.
- Run
adb logcat | grep Web(Android 5.0.0 and newer) oradb logcat browser:V *:S(Android 4) in the terminal. - Launch the app in your mobile device. Console output from the app should appear in the terminal.
1 | $ adb logcat | grep Web |
Console emulator in the app
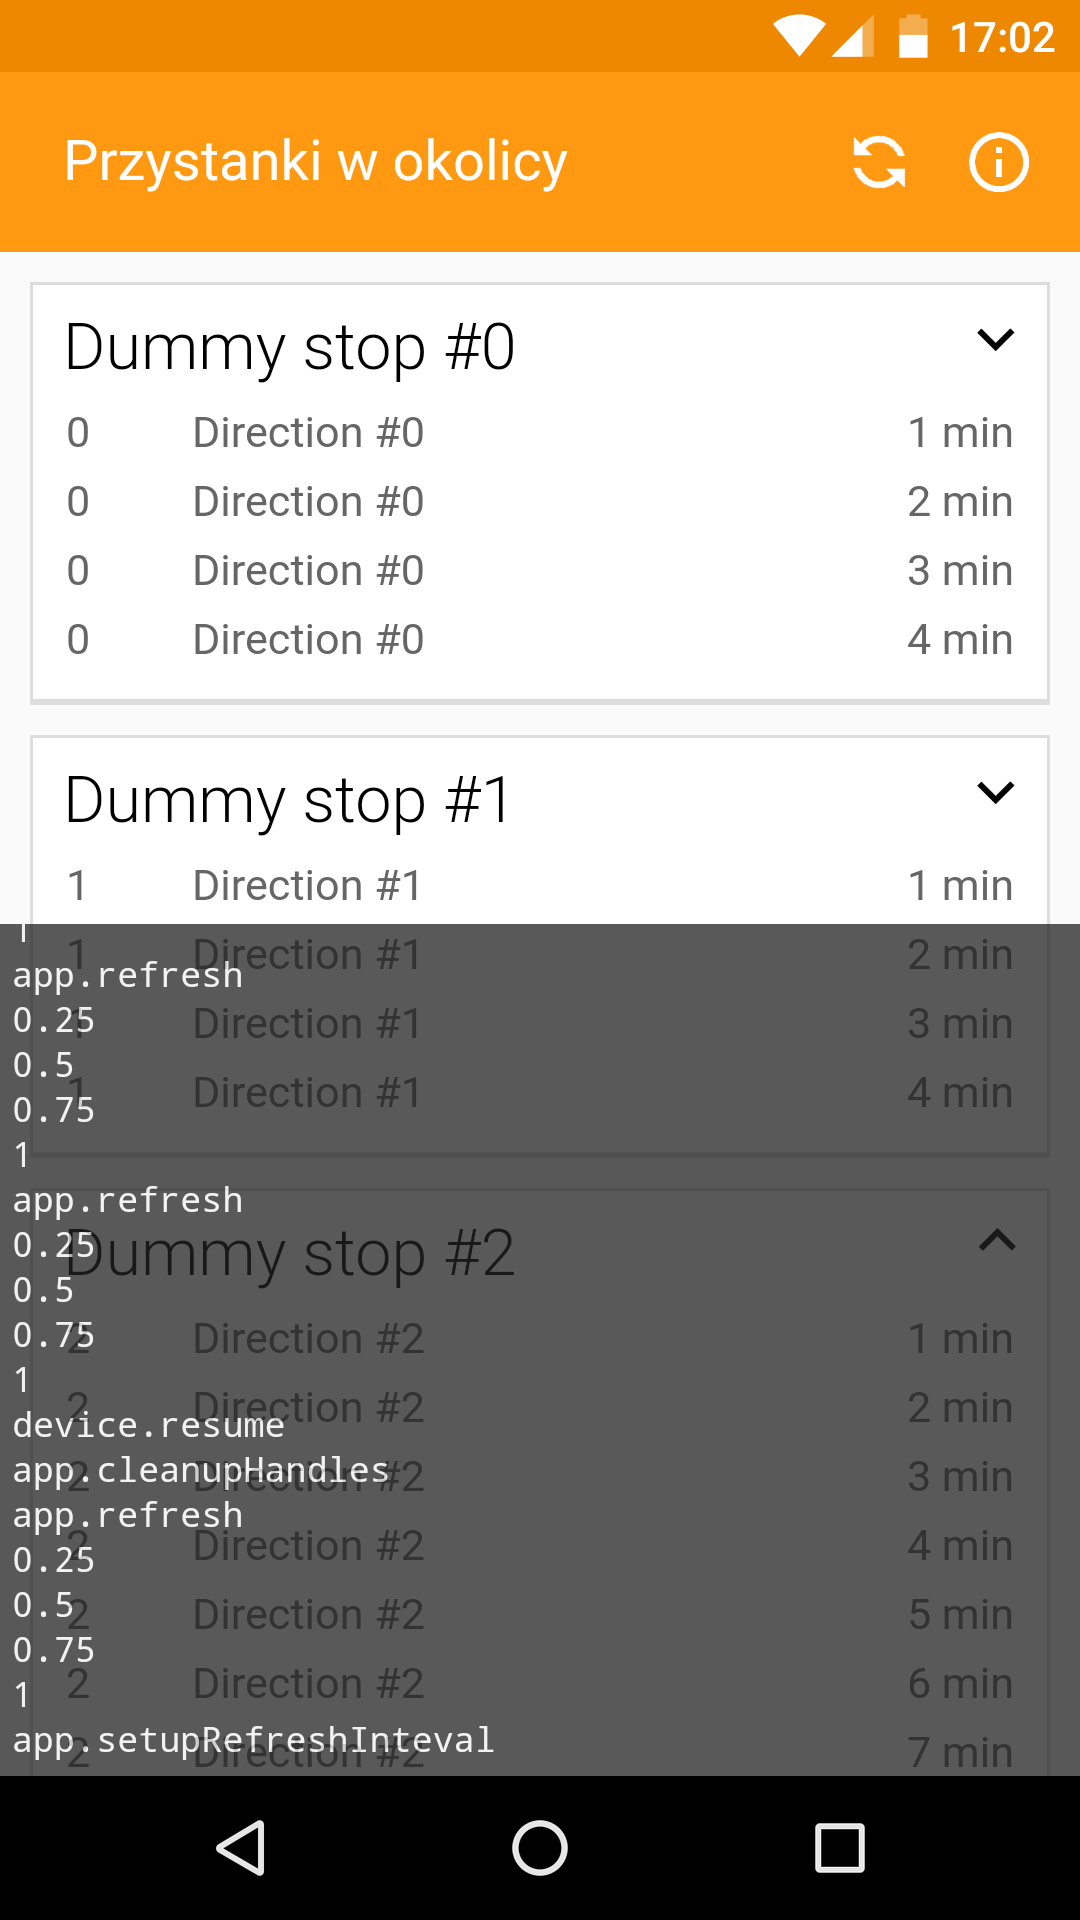
It may sound crazy, but it’s very useful to dump all of the log messages into a hidden container within the HTML. In one of my apps I’ve implemented a secret debug console, that appears after using the Konami Code (not so secret anymore).

Thanks to this I am able to see what is going on in the application during the testing phase in the field or after the release. It also allowed me to track some of the bugs that were foreseen during the devlopment phase (mostly related to the app’s lifecycle).
Summary
In the majority of cases, debugging Cordova applications do not differ very much from debugging regular web pages. Thanks to cordova serve command and Chrome Remote Debugging it is much less painful that it used to be. Weinre provides very similar functionality, however its configuration may be a bit challenging at the first time.
However, there are some rare situations when those three are not sufficient for the task, especially when running on a real device. If that happens, we can always use non-typical aproaches, such as hidden debug console in the app or processing raw log output from the ADB.
Happy debugging! 🐛
Photo by Lilly Rum on Unsplash.